MI (Management Information)
 Updated
by
Arianne G.
Updated
by
Arianne G.
- Access M.I. (Management Information) Reports
- Generate reports
- View reports
- Additional Report Criteria and Filters
- REPORTS
- Assignment Ageing
- Average Value
- Estimate Audit Results
- Estimate Inclusion Issues
- Estimate Scoping Overlap
- Estimates with Sketches and Photos
- Frequently Used Items
- Initial Response Time
- Response Time
- Peril
- User Productivity
M.I. (Management Information) reports help you better monitor the work performed by your employees and trends in materials usage and cost.
The screenshots in this document are generic, and your company’s interface may vary.
Select a report to view detailed information about that report:
Related: Activity Reports, Statuses
Access M.I. (Management Information) Reports
- Select M.I. (Management Information) Reports from the Reports menu.
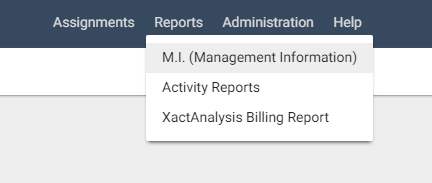
The Management Information Reports page appears.
Generate reports
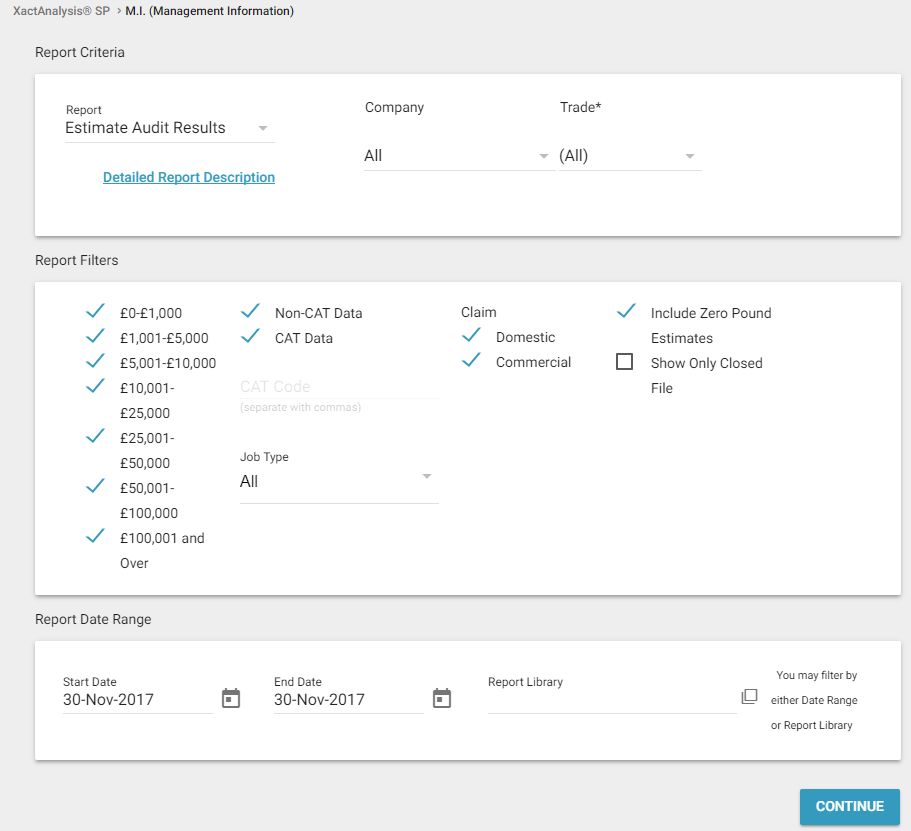
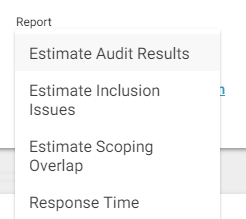
- Select a report from the Report dropdown menu.
- Use the menus, fields, and checkboxes in the Report Criteria and Report Filters sections to filter the data you want displayed in the report. See Additional Report Criteria and Filters for information about each menu, field, and checkbox.
- Click the Start Date and End Date SmartCalendar buttons to choose start and end dates for the report, and click Continue.
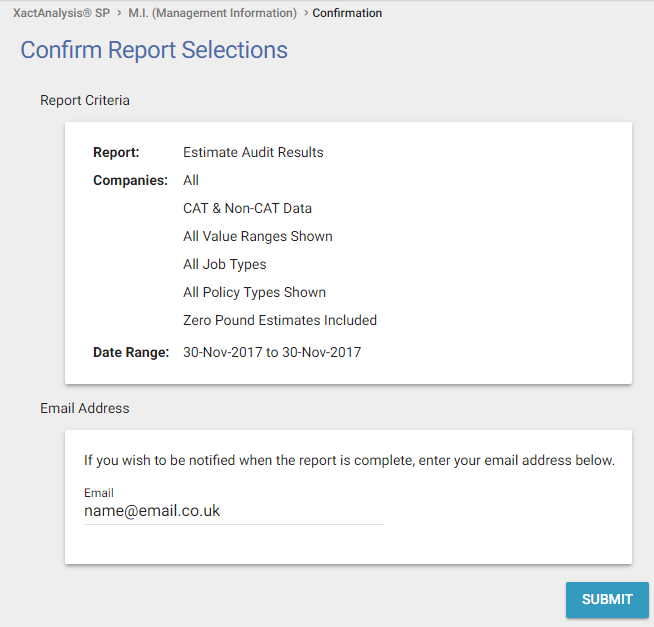
- Make sure the email address in the address field is correct, and click Submit. If you do not enter an email address, the report will still be generated, but you will not be notified. You can find the report in the Report Library once it has been generated.
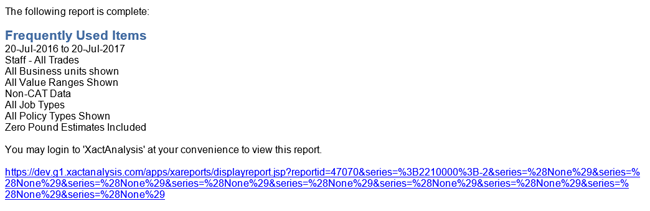
- If you entered an email address, you’ll receive an email with a link to the report. Select this link to see the report.
View reports
Report header
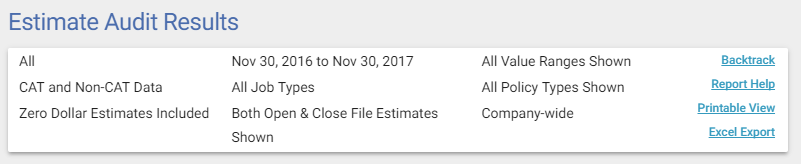
When viewing a report, you’ll see a report header above the report. This header displays your report filter selections and a number of links.
The Backtrack link is available if you’ve navigated to a different hierarchy level in the report. When you select this link, the previously viewed hierarchy level appears. When you select Printable View, a printable view of the report appears. When you select Excel Export, the current view of the report data is exported to an Excel worksheet. When you select Report Help, the report description in the Interactive User's Guide appears.
Hierarchy tree
A hierarchy tree appears to the left of each report, dependent on your organisation’s hierarchy, your security rights, and the report criteria. Select a plus sign to the left of a level label to expand the tree and see lower levels of the hierarchy. When you select a specific level (not a plus or minus sign, but the label), the report changes to show data for that level only. Your company may use Organisational Hierarchy, in which case the hierarchy tree would show office levels rather than geographic areas.
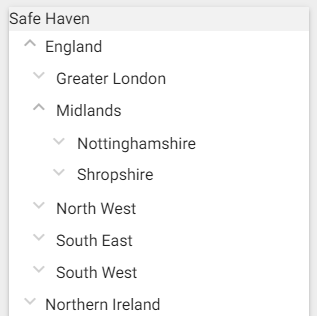
You can also select table row labels and graph bars in graphical reports to view data for other levels of your hierarchy. With most reports, you can view individual estimate data using these links.
Additional Report Criteria and Filters
The Management Information Reports menus, fields, and checkboxes are defined below.
Report Criteria
Report
Select the report you want to create.
Trade
Select a trade to see estimate data for that trade only. The available trades are dependent on your rights and company settings.

Report Filters
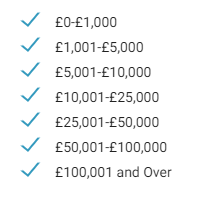
Loss Size
Clear the loss size checkboxes to exclude data for estimates with those loss sizes from the report.
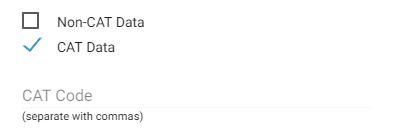
CAT Data
Clear the Non-CAT Data checkbox if you want to see information for estimates with CAT data only and vice versa. If only the CAT Data checkbox is selected, you can type one or more CAT codes in the field below the checkbox to see data for only those CAT codes.
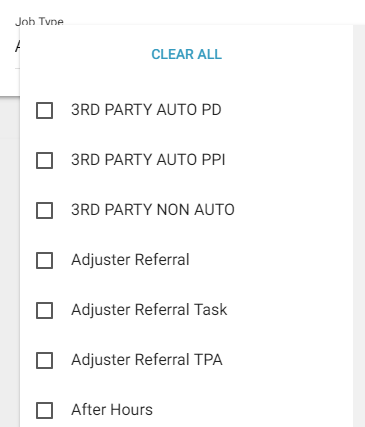
Job Type
Select one or more job types to see only estimates with the selected job types in the report.
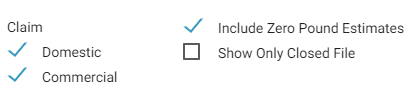
Other report filters
Clear the checkboxes for Domestic, Commercial, and Include Zero Pound Estimates to exclude these types of estimates from the report. Select the Show Only Closed File checkbox to see data for only closed files in the report.
REPORTS
Assignment Ageing
This report displays information about assignments with 1–2 weeks and 2+ weeks of inactivity, by area, adjuster or contractor, and claim reference. Inactive assignments have not been returned to XactAnalysis, cancelled, or rejected. This information helps to make you aware of adjusters or contractors with ageing assignments. Assignments are removed once they are returned, cancelled, or rejected.
The date range for this report is the 12 months prior to the report generation date. Ad hoc date ranges are not used, as the intent is to display current data rather than data for a specific period of time.
Columns
Assignment: Claim reference and adjuster or contractor
1–2 weeks since last activity: Number of aging assignments with 1–2 weeks of inactivity
2+ weeks since last activity: Number of aging assignments with 2+ weeks of inactivity
Average Value
This report displays the number of estimates in each region / office level, their value, and their average value. This information helps you see geographic/organisational trends in estimate value.
- Select a geographic/organisational area link to see data for other levels of your hierarchy, including individual estimates.
Columns
Region / Office Level: Geographic/organizational area
Total Estimates: Number of estimates
Average Estimate Value: Average value per estimate (Total Estimate Value / Total Estimates)
Total Estimate Value: Total estimate value
% of Total Estimates: Percentage of total estimates
% of Total Estimate Value: Percentage of total estimate value
Estimate Audit Results
This report displays the audit results derived from estimate audits/inspections, helping you see the effectiveness of audits/inspections.
- Select a property owner link to view assignment details.
Columns
Estimate: Property owner name
Claim Reference: Claim reference
Estimate Date: Date estimate was returned to XactAnalysis®
Estimate Value: Estimate value
Inspection Audit: Value indicating if inspection audit was performed on estimate (Y/N)
Inspection Findings: Value indicating if inspection audit produced findings (audit engine in Xactimate® found audit results and reported them to adjuster or contractor) (Y/N)
Inspection Results: Value indicating if inspection audit produced results (adjuster or contractor made changes to estimate to correct audit results) (Y/N)
Audit Results: Pound amount discrepancy discovered through audit
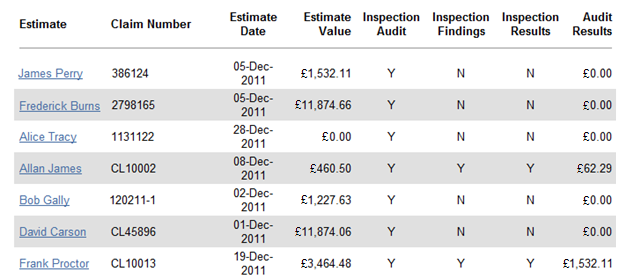
Estimate Audit Results report
Estimate Inclusion Issues
This report displays the percentage and number of instances in which work may have been duplicated on estimates. It does this by detecting combinations of item codes that involve duplication. For instance, a line item (e.g., a new sink) may have been included twice on the estimate, when it was intended to be included once. This report helps you track and address estimate errors, ultimately reducing costs due to waste and error.
- Select a bar in the graph or a flooring category in the table to see data for individual estimates and specific line items that violated a rule.
Estimate Inclusion Issues by Instance graph
This graph displays each inclusion issue type found in estimates and the percentage of issues each type had. Hover over the bars to see the number of instances.
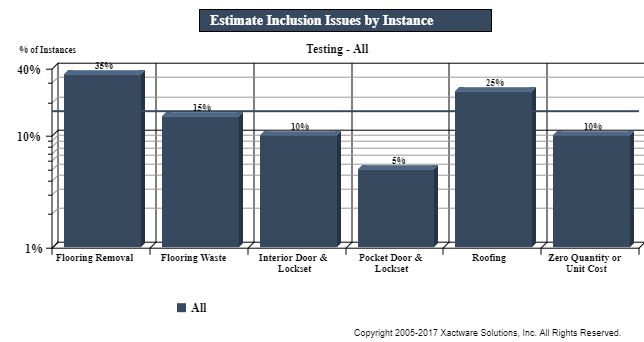
Estimate Inclusion Issues by Instance graph
Estimate Inclusion Issues by Estimate graph
This graph displays each inclusion issue type found in estimates and the percentage of estimates with the identified issues. Hover over the bars to see the number of estimates.
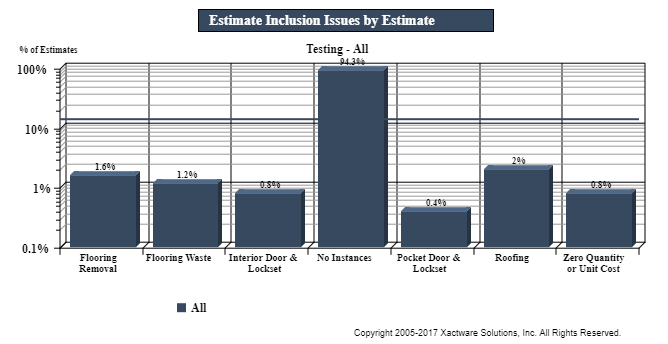
Estimate Inclusion Issues by Estimate graph
Table columns
Instances: Number of inclusion issue instances
Estimates: Number of estimates
Avg Instances per Estimate: Average number of inclusion issue instances found per estimate (Instances / Estimates)
% of Instances: Percentage of total instances
% of Estimates: Percentage of total estimates
Table rows
Inclusion issue categories
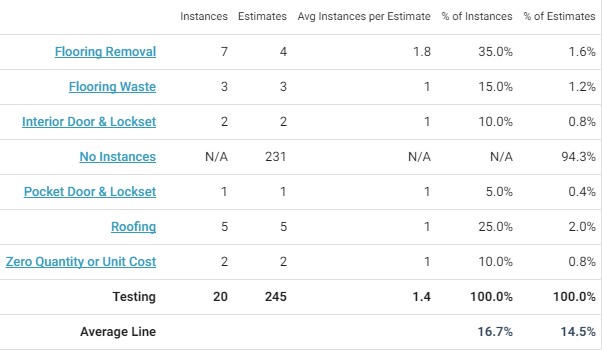
Estimate Inclusion Issues table
Estimate Scoping Overlap
This report displays the percentage and number of possible quantity calculation errors in estimates. It does this by checking for instances in which the quantity specified for a line item exceeds the maximum or usual maximum quantity for such an item in the room. This report helps you track and address estimate errors.
- Select a bar in the graph or an instance category in the table to see data for individual estimates and specific line items that violated a rule.
Estimate Scoping Overlap by Instance graph
This graph displays the percentage of scoping instances by instance category. Hover over the bars to see the number of instances.
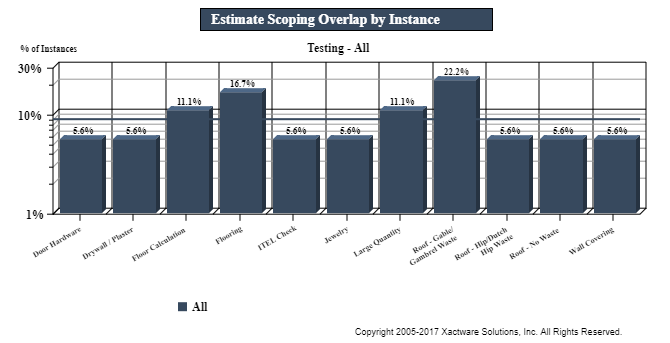
Estimate Scoping Overlap by Instance graph
Estimate Scoping Overlap by Estimate graph
This graph displays the percentage of estimates with scoping instances by instance category. Hover over the bars to see the number of estimates.
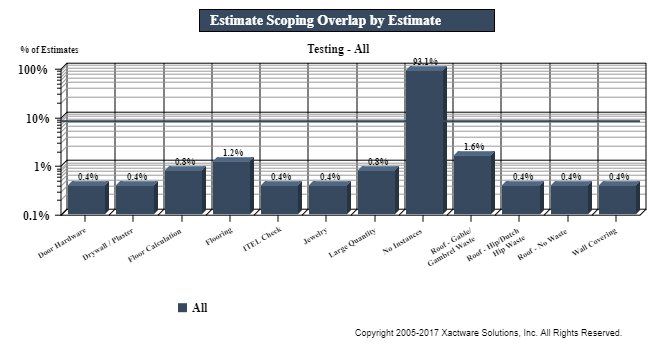
Estimate Scoping Overlap by Estimate
Table columns
Instances: Number of instances
Estimates: Number of estimates with overlap issues
Avg Instances per Estimate: Average number of instances per estimate (Instances / Estimates)
% of Instances: Percentage of total instances
% of Estimates: Percentage of total estimates
Table rows
Instance categories
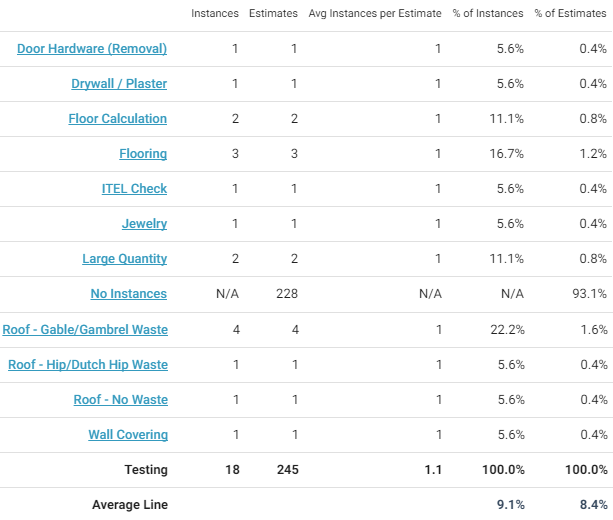
Estimate Scoping Overlap table
Estimates with Sketches and Photos
This report displays the number and percentage of estimates that have been uploaded with or without sketches and with or without photos. This helps you monitor which adjusters or contractors are uploading photos and sketches.
- Select a geographic/organisational area link to see data for other levels of your hierarchy, including individual estimates.
Columns
Region / Office Level: Geographic/organizational area
Total Estimates: Number of estimates
Estimates with Sketches: Number of estimates uploaded with a sketch
Estimates without Sketches: Number of estimates uploaded without a sketch
% Estimates with Sketches: Percentage of estimates uploaded with a sketch
% Estimates without Sketches: Percentage of estimates uploaded without a sketch
Estimates with Photos: Number of estimates uploaded with a photo
Estimates without Photos: Number of estimates uploaded without a photo
% Estimates with Photos: Percentage of estimates uploaded with a photo
% Estimates without Photos: Percentage of estimates uploaded without a photo
When you drill down to the individual adjuster or contractor, additional columns appear.
Columns
Policyholder: Name of the policyholder
Estimate Date: Date the estimate was returned into XactAnalysis
Num Sketches: Number of sketches attached to an estimate
Num Photos: Number of photos attached to an estimate
Estimate Value: Total value of estimates
Frequently Used Items
This report displays the price list items used in a given set of estimates, sorted from most frequently used to least frequently used.
- Select a category code to see data for other levels of your hierarchy, including individual estimates.
Columns
Category Code: Code for categorising a line item
Selector Code: Code for selecting a line item
Description: Line item description
Item Count: Number of times line item was used
Estimates: Number of estimates
Total Item Value: Total line item value
Total Estimates Value: Total estimate value
Avg Item £ Value per Estimate: Average line item value per estimate (Total Item Value / Estimates)
Avg Estimate Value: Average estimate value (Total Estimates Value / Estimates)
Total ACV: Total actual cash value (RCV - Depreciation)
Total Net Value: Total Net Value
Initial Response Time
This report displays the original adjuster's or contractor’s (the individual that first returned the estimate) response times for each step of the estimate process. It shows returned estimate data only. The start time for the response time calculations is Assignment Received date. This report helps you monitor adjuster or contractor activity, specifically their timeliness in progressing assignments.
- Select a geographic/organisational area link to see data for other levels of your hierarchy, including individual estimates.
Columns
Region / Office Level: Geographic/organisational area
Total Estimates: Number of estimates
Avg Days until Contacted: Average number of days for the status to change from Assignment Received (the date the assignment was first received into the Assignment Queue or first assigned to an adjuster and contractor) to Customer Contacted (recipient made first contact with insured)
Avg Days until Inspected: Average number of days for the status to change from Assignment Received (the date the assignment was first received into the Assignment Queue or first assigned to an adjuster and contractor) to Site Inspected (site inspected by assignment recipient)
Avg Days from Contacted to Inspected: Average number of days for the status to change from Customer Contacted (recipient made first contact with the insured) to Site Inspected (site inspected by assignment recipient)
Avg Days until Returned: Average number of days for the status to change from Assignment Received (the date the assignment was first received into the Assignment Queue or first assigned to an adjuster and contractor) to Returned (estimate returned to XactAnalysis from assignee)
Avg Days from Inspected to Returned: Average number of days for the status to change from Site Inspected (site inspected by assignment recipient) to Returned (estimate returned to XactAnalysis from assignee)
Response Time
This report displays response times for each step of the estimate process. The start time for the response time calculations is Assignment Received date. This report helps you monitor adjuster or contractor activity, specifically their timeliness in progressing assignments.
- Select a property owner link to see data for other levels of your hierarchy, including individual estimates.
Columns
Estimate: Property owner name
Date Received: Date the assignment was first received into the Assignment Queue or assigned to an adjuster or contractor. If the assignment was sent to the Assignment Queue first, the Received date is updated when it is assigned to an adjuster or contractor. After being assigned the first time, the Received date is no longer updated (the Reassignment, Referral, or Collaboration statuses are used instead).
Date Contacted: Date property owner was contacted
Date Inspected: Date property was inspected
Date Returned: Date completed estimate was returned to XactAnalysis
Date QA Approved: Date estimate was QA Approved
Date Client Approved: Date estimate was Client Approved
# Days until Contacted: Average number of days from status Assignment Received (the date the assignment was first received into the Assignment Queue or first assigned to an adjuster and contractor) to Customer Contacted (recipient made first contact with insured)
# Days until Inspected: Average number of days from status Assignment Received (the date the assignment was first received into the Assignment Queue or first assigned to an adjuster and contractor) to Site Inspected (site inspected by assignment recipient)
# Days from Contacted to Inspected: Average number of days from status Customer Contacted (recipient made first contact with the insured) to Site Inspected (site inspected by assignment recipient)
# Days until Returned: Average number of days from status Assignment Received (the date the assignment was first received into the Assignment Queue or first assigned to an adjuster and contractor) to Returned (estimate returned to XactAnalysis from assignee)
# Days from Inspected to Returned: Average number of days from status Site Inspected (site inspected by assignment recipient) to Returned (estimate returned to XactAnalysis from assignee)
# Days from Returned to QA Approved: Average number of days from status Returned (estimate returned to XactAnalysis from assignee) to QA Approved
# Days from Returned to Client Approved: Average number of days from status Returned (estimate returned to XactAnalysis from assignee) to Client Approved
Estimate Value: Estimate pound value
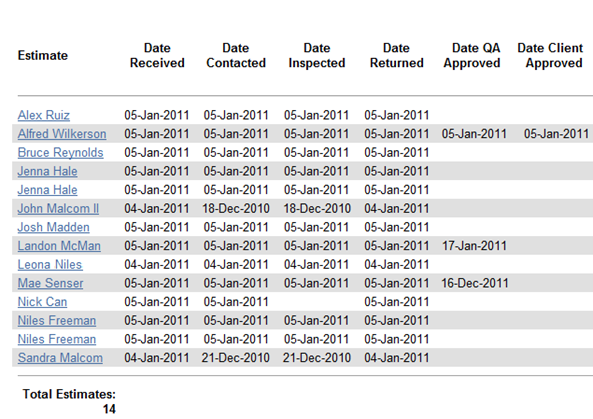
Response Time report
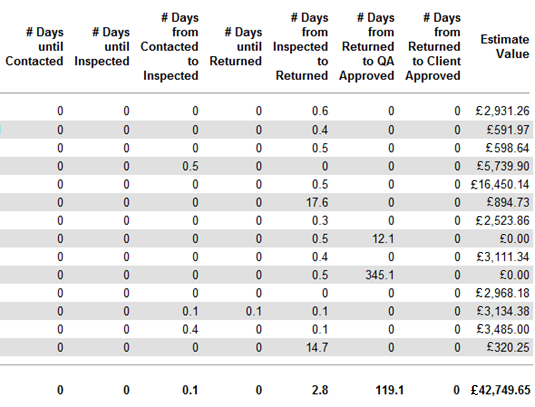
Response Time report, continued
Peril
This report displays estimate information by peril, helping you see trends in peril costs.
- Select a peril to see data for your hierarchy levels, including individual estimates.
Columns
Peril: Peril category (Collapse, Earthquake, etc.)
Cause: The Cause category states the reason the peril occurred. For example, a cause of a fire peril could be Candle, Cooking, or Defective Appliance.
Total Estimates: Number of estimates
Average Estimate Value: Average estimate value (Total Estimate Value / Total Estimates)
Total Estimate Value: Total estimate value
% of Total Estimates: Percentage of total estimates
% of Total Estimate Value: Percentage of total estimate value
User Productivity
This report displays the volume and rate of items added and priced, by vendor. This helps you see the productivity of specific vendors.
- Select a vendor to view information for individual estimates.
Columns
Name: Vendor name
User: Vendor user name
Email: Vendor email
Contents Collab Items Added: Number of line items that were added through the contents collaboration process
Excel Items Added: Number of line items that were added using an Excel worksheet
Normal Items Added: Number of items that were added normally
Items Priced: Number of items priced
Change in Number of Items: Total number of items changed
Elapsed Time (hours): Number of hours logged into XactContents
Avg. Items Added per Hour: Average number of items added per hour
Avg. Items Priced per Hour: Average number of items priced per hour