Welcome Page
 Updated
by
Arianne G.
Updated
by
Arianne G.
The XactAnalysis SP Welcome page is divided into four sections: menus, customizable icons, Quick Search, and Quick View reports.
The screen shots in this document are generic, and your company's interface may vary.
Related: Getting Started, Manage Accounts, FAQ > System Requirements
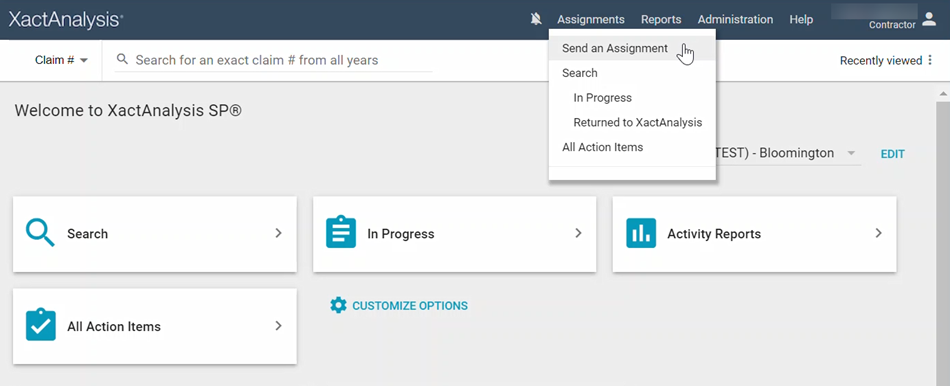
Menus
The Assignments, Reports, Administration, and Help menus appear at the top right of every page in XactAnalysis SP. Use these menus to access almost every area of XactAnalysis SP. The three main menus, Assignments, Reports, and Administration, correspond with training sections in the left pane of this guide.
Manage Accounts
- Click your name in the top right corner of the page and select Manage Accounts to link or unlink accounts with your Xactware ID. See Manage accounts for more information.
- If you have more than one linked account, click your name in the top right corner of the page and select one of the accounts to switch to it.
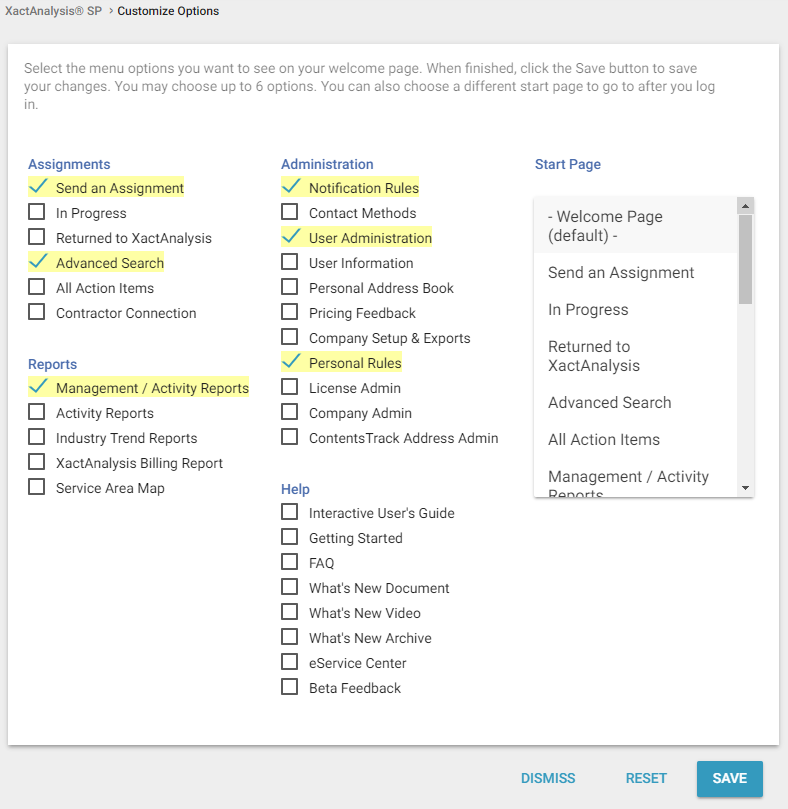
Customizable menu options
The Welcome page includes a number of icons you can click to jump to your most frequently used XactAnalysis SP modules. By default, the Advanced Search, In Progress, Activity Reports, and All Action Items icons appear.
- Click Customize Options to go to the Customize Options page where you can add or remove module icons from the Welcome page and change your default start page.
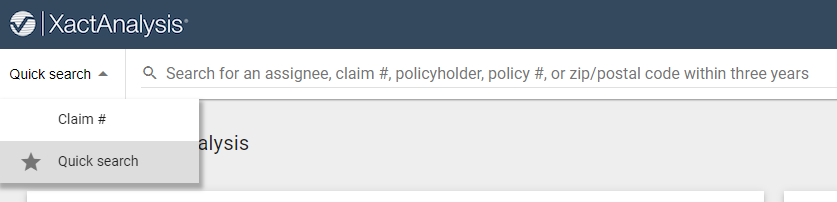
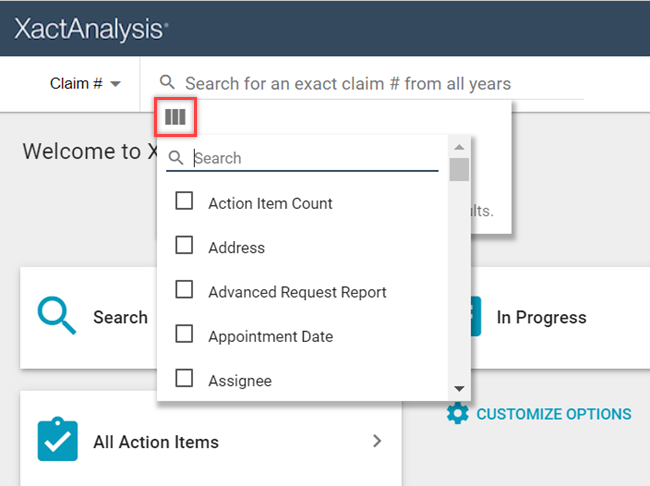
Quick Search
The Quick Search bar at the top of every page has two modes to help you find assignments. Click the menu button to the left of the bar and select an option:
- The Claim Number option allows you to search for a claim number without any date range restrictions. Only exact matches are returned, and if only one assignment has that claim number , you are automatically taken to its assignment details.
- The Quick Search option allows you to search for assignments by claim number, insured name, assignee, policy number, or postal code within the last three years.
Select a default menu option
You can select a default menu option by clicking the menu, hovering over an option, and clicking the star that appears next to the option. That option is selected every time you log in to XactAnalysis.
Customize Claim Number columns
When you select the Claim Number option and type a claim number in the search bar, a results box appears with four customizable columns. You can change which columns appear in this box to display different information about your claim results.
To change the columns, click the Columns button in the top-left corner of the results box, disable any of the four currently selected columns, and select up to four new columns.
Quick View
The Quick View section displays assignment data in a number of reports, including Recently Viewed Assignments, Active Task List, Average Response Times, Completed Assignment Summary, Control Center Dashboard, Cycle Times, and Overall Consumer Satisfaction.
- Select these reports from the Quick View menu.
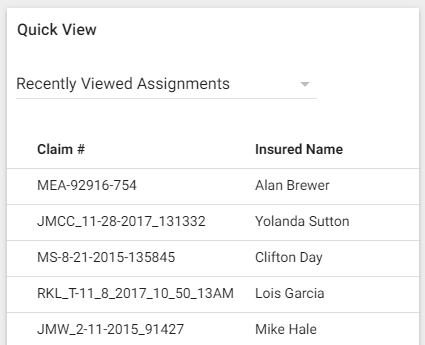
Recently Viewed Assignments
This report displays a list of assignments you have recently viewed.
- Select an assignment to go to its Assignment Detail page.
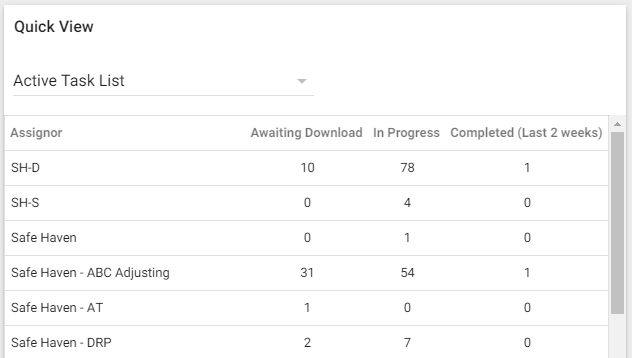
Active Task List
This report displays the number of assignments awaiting download, in progress, and completed (in the last two weeks), by assignor.
- Select an Assignor name or Totals to see the selected data in the Assignment Activity report format.
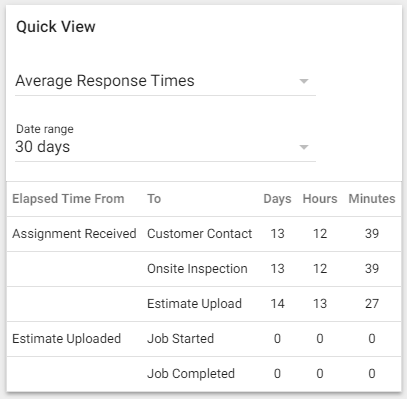
Average Response Times
This report displays the average time it takes your company to perform specific assignment tasks. The average time is calculated from assignments sent to your company over the last 90 days.
- Adjust the number of days using the menu directly above the table.
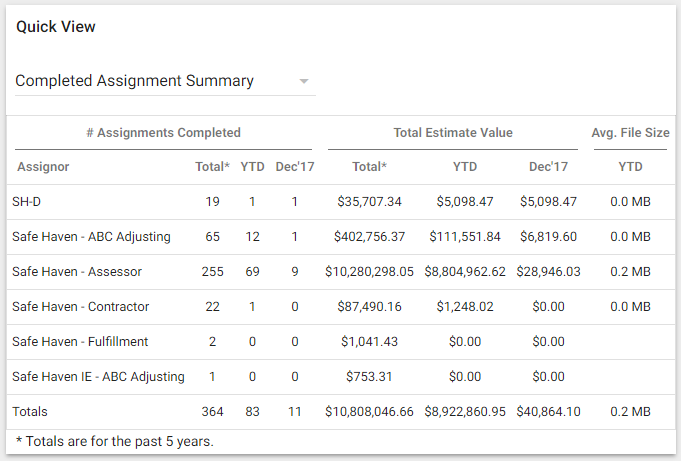
Completed Assignment Summary
This report displays completed assignment data by assignor, helping you see the volume and dollar value of assignments received from each assignor.
- Select an Assignor name or Totals to see the selected data in the Assignment Summary report format.
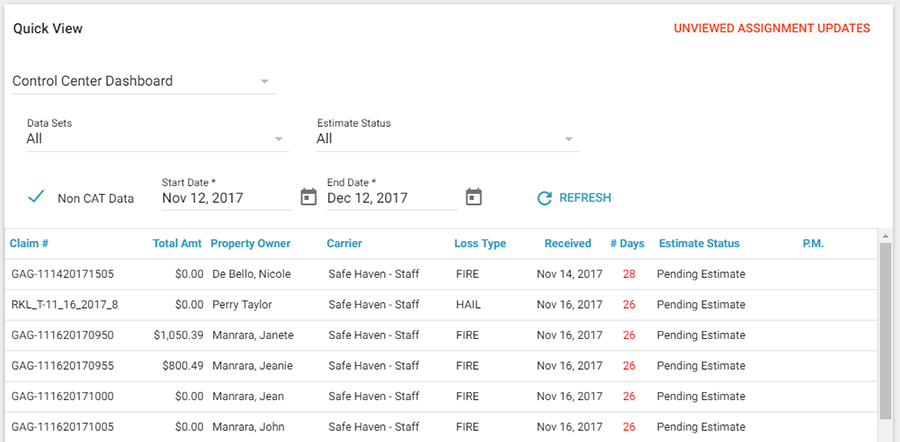
Control Center Dashboard
This report displays detailed estimate information. The following filters control the estimates that appear in the report:
Datasets
If available, select a data set to see assignments in that data set only.
Estimate Status
Select a status to see assignments with that status only.
Non CAT Data
Select this check box to see assignments with non-CAT data only.
Date Filters
Use the SmartCalendar buttons to select a date range. The report will show assignments received during this date range.
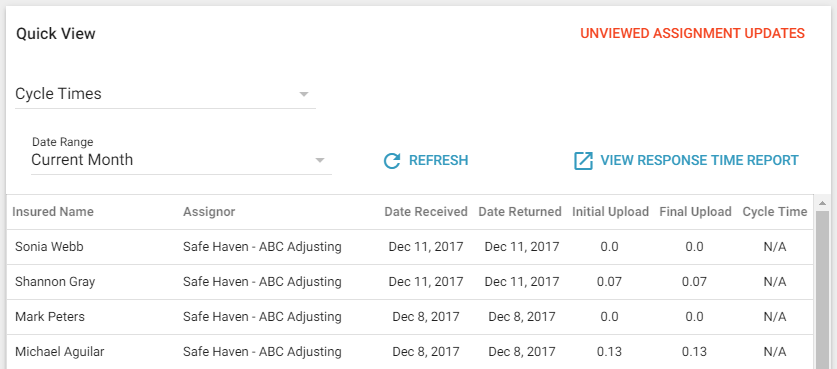
Cycle Times
This report displays the number of days between Assignment Received date and Initial Upload (Initial Upload column), Final Upload (Final Upload column), and Date Returned (Cycle Time column) for each estimate.
- Select a period of time in the Current Month filter to see estimates received during that period only.