What's New in XactInsights
 Updated
by
Arianne G.
Updated
by
Arianne G.
XactInsights releases contain new features designed to improve your Insights experience. Highlights from the releases are listed below. For a complete list of changes, please see the release notes in the eService Center.
July 30, 2025
Starting on July 31, 2025, all dates are displayed within XactInsights as Coordinated Universal Time (UTC), the global time standard used to ensure consistency and avoid ambiguity across different time zones.
By standardizing all timestamps to UTC, systems can accurately compare, sort, and query time-based data without being affected by regional time zone differences or daylight-saving time changes. This approach is especially important in distributed applications, where users or systems may operate in multiple geographic locations.
Due to this change, most of the dates displayed within XactInsights will be displayed earlier than expected if the report includes other Verisk products such as Xactimate and ClaimXperience.
To learn how to convert UTC to your local time zone, consult this article.
Previous updates
April 9, 2025
Search
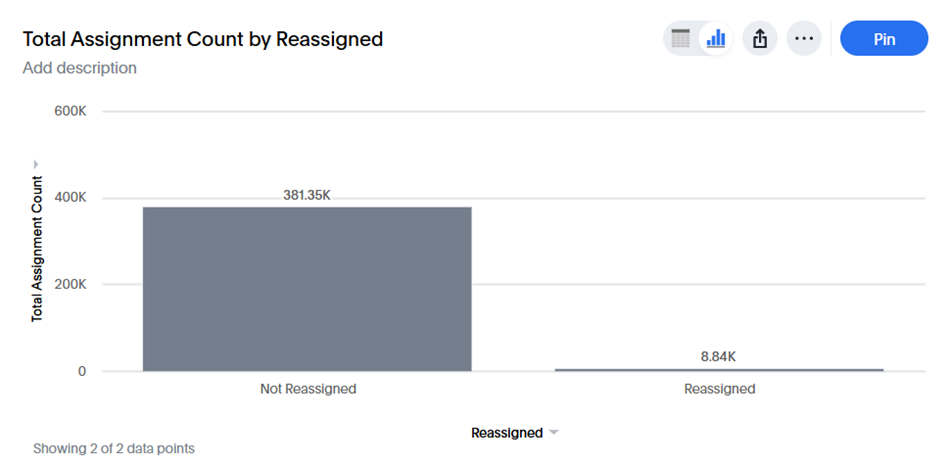
Per your feedback, we added some useful new columns to multiple worksheets! First, we added a new Reassigned column to the Contractor Claims and Contractor Line Item worksheets. This column shows if an assignment was reassigned.
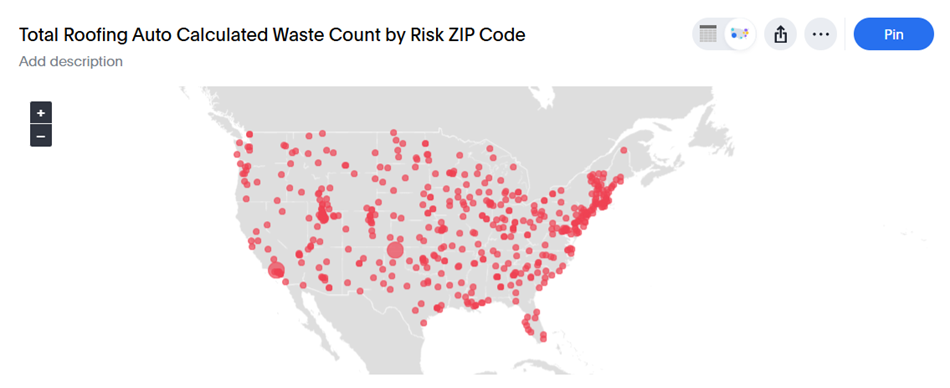
Next, we added three new columns to the Line Item worksheet:
- Roofing Auto Calculated Waste Percent
- Roofing Auto Calculated Waste Count
- Roofing Auto Calculated Waste Used
These columns show the percentage used for auto-calculated waste on roofing items, the number of roofing items that used auto-calculated waste, and whether or not auto-calculated waste was used on roofing items, respectively.
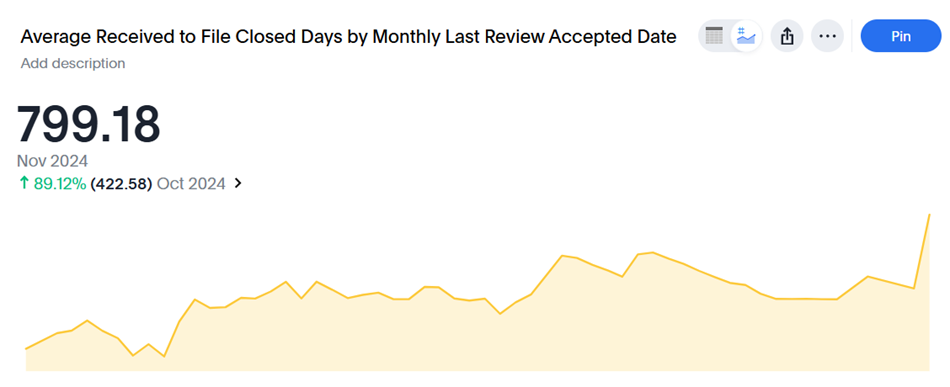
We added four new columns to the Claims worksheet:
- First Review Accepted Date
- Last Review Accepted Date
- First Proxy Review Accepted Date
- Last Proxy Review Accepted Date
First Review Accepted Date displays the date that a review is first accepted in XactAnalysis, while Last Review Accepted Date displays the date that a review is last accepted; First Proxy Review Accepted Date and Last Proxy Review Accepted Date do the same, except the dates that they display are for proxy or umbrella companies.
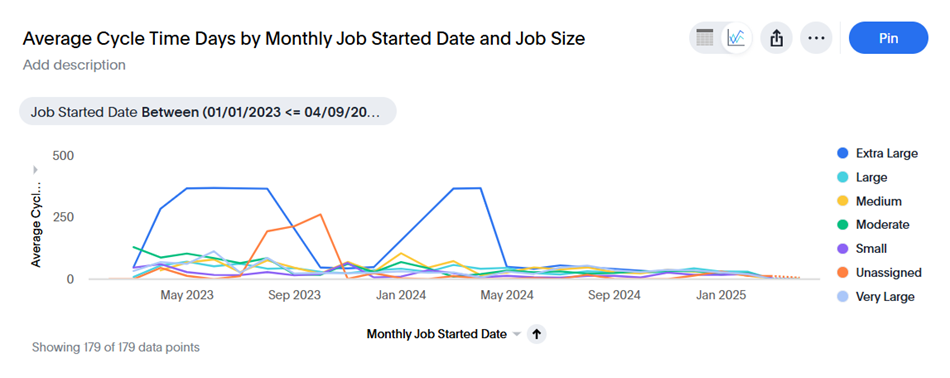
Finally, we added the Job Started Date and Job Completed Date columns to the Industry Claim Data and Industry Line Item Data worksheets. These columns already existed in the Claims worksheet, but now you can use them in your Industry searches as well! Job Started Date is the date that a job is started, and Job Completed Date is the date that a job is completed.
Liveboards
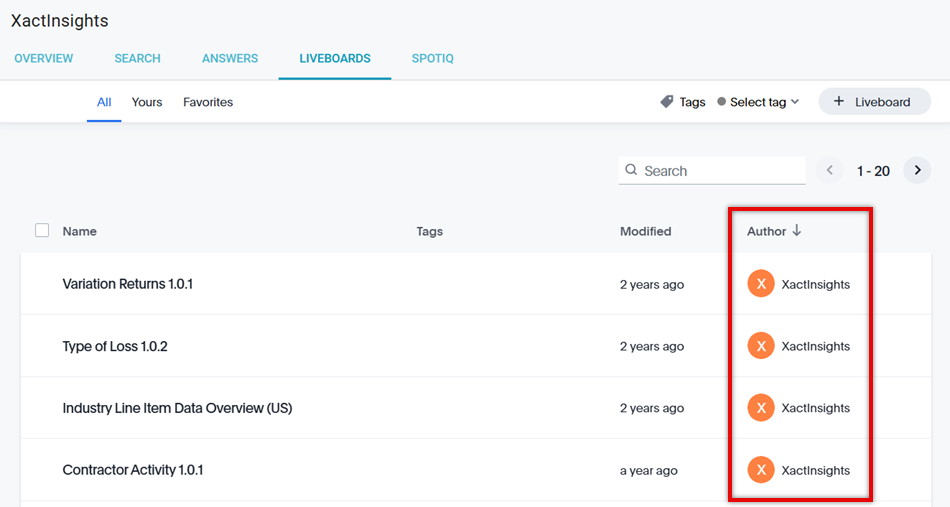
We updated the Liveboards tab to reflect the new XactInsights name! Now, instead of XactAnalysis Insights, the author shown for our pre-built liveboards is XactInsights.
February 26, 2025
This release consisted of bug repairs and performance enhancements.
January 29, 2025
Search
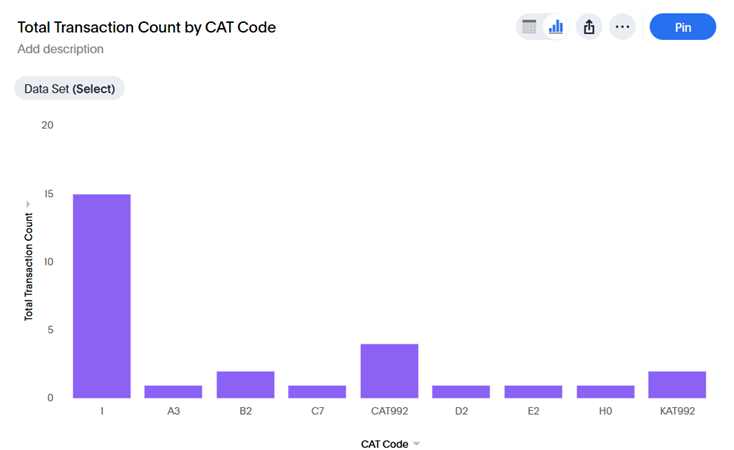
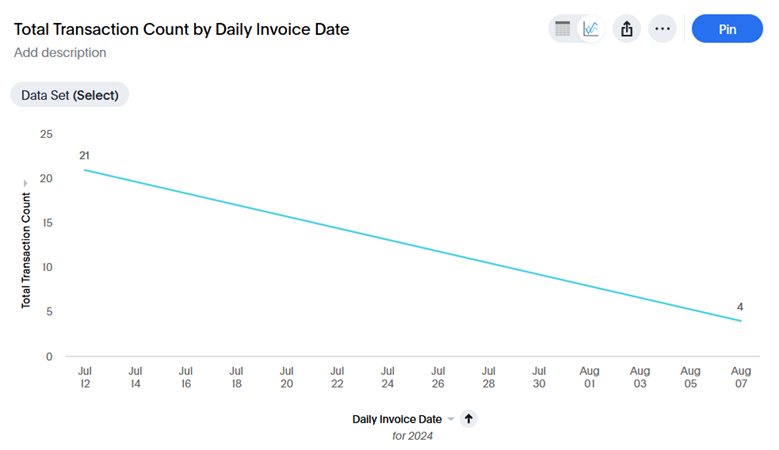
Based on your feedback, we added three columns to the Transactions and Transactions Contractor worksheets: CAT Code, Invoice Date, and Policy Number. When added to a search, the CAT Code column will display the name or code of the catastrophe as entered by an account user.
Invoice Date shows the date that the invoice was created, while Policy Number shows the policy number associated with the policyholder.
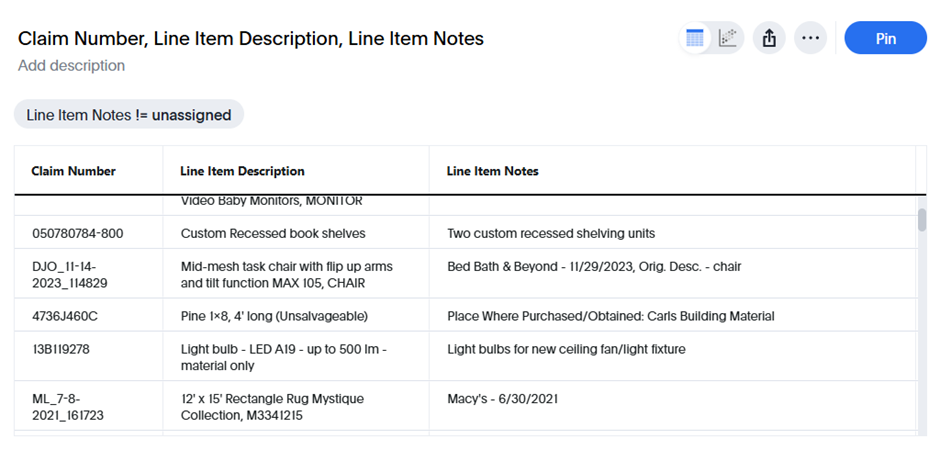
We also added a new Line Item Notes column to the Line Item, Line Item Summary, and Contractor Line Item worksheets. This column shows the notes attached to line items in Xactimate, often colloquially referred to as “f9 notes”. For more information on line item attachments, please see the Attach or delete notes, images, or sound files to a line item in X1 article.
December 4, 2024
Search
Billing
Based on your feedback, we added multiple columns to the Transactions and Transactions Contractor worksheets! First, we added Assignee and Contractor Company Name columns to the Transactions Contractor worksheet; Assignee shows the name of the adjuster or contractor that the assignment is assigned to, while Contractor Company Name allows you to sort and filter your billing data by different contractor companies.
Finally, we added the Invoice Number columns to both the Transactions and Transactions Contractor worksheets. You can use this column to view billing data for specific invoices.
XactXpert
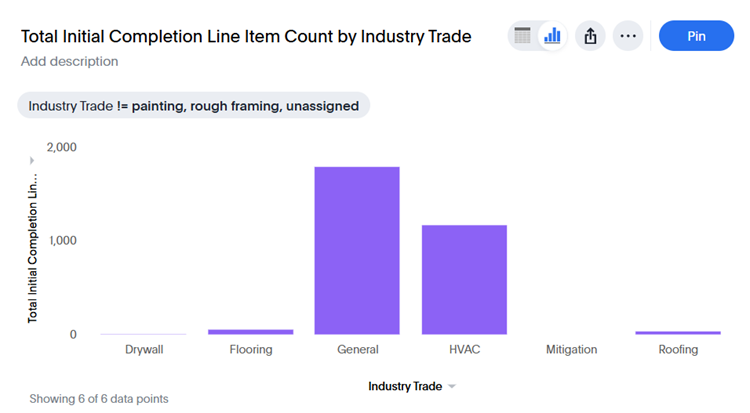
We added several new columns to our XactXpert worksheets! To the XactXpert Line Item Summary Differences and XactXpert Impact worksheets, we added four columns: Initial XactXpert Review Line Item Count, Initial Completion Line Item Count, First Estimator, and First XactXpert Review Initiator. First Estimator and First XactXpert Review Initiator show the first estimator and the first review initiator for the estimate, respectively. Initial XactXpert Review Line Item Count and Initial Completion Line Item Count show the number of line items when an estimate is first reviewed and when an estimate is first marked as complete, respectively.
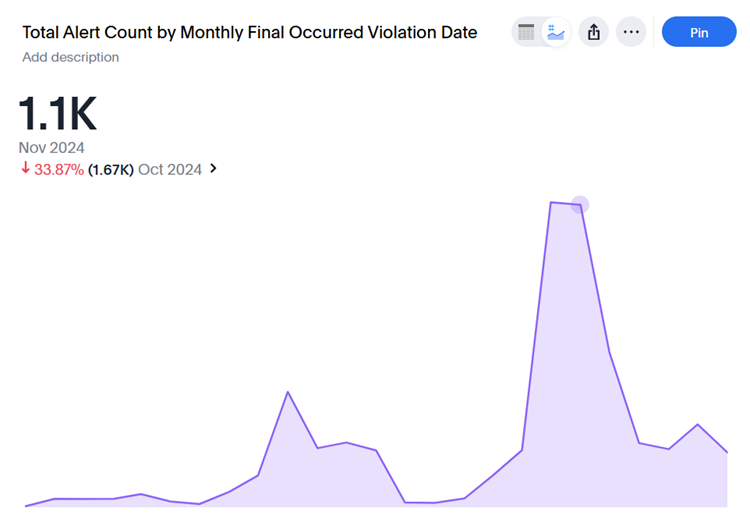
We also added two columns to the XactXpert Rule Alerts worksheet: Original Occurred Violation Date and Final Occurred Violation Date. These columns show the first and last dates that a violation occurred.
Liveboards
You can now filter the Billing (Contractor) liveboard by Contractor Company Name.
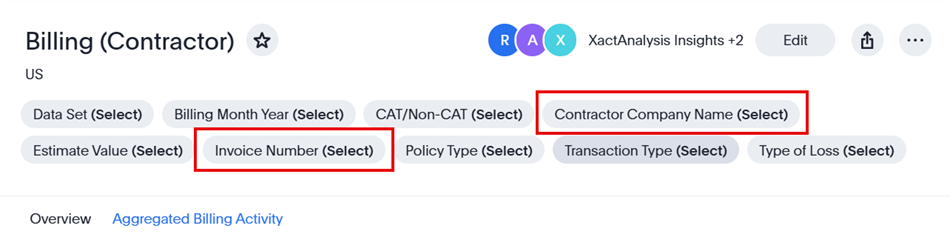
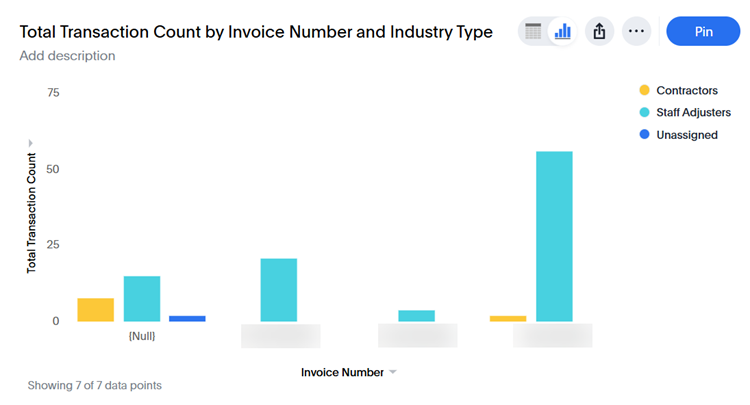
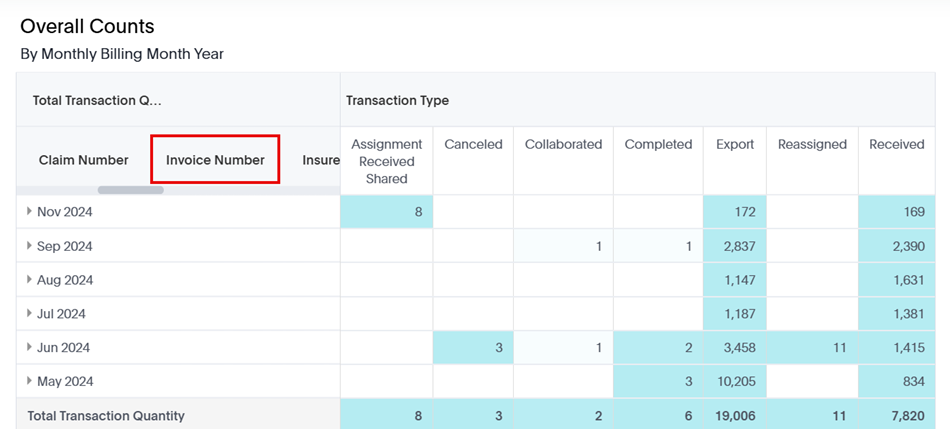
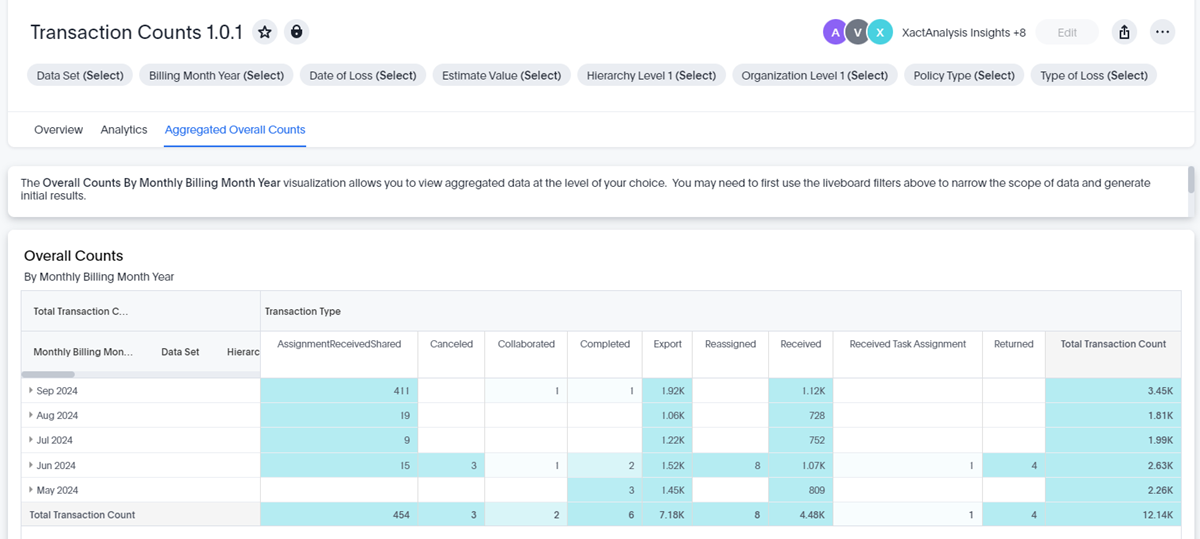
We also added the Invoice Number column to both the Billing (Contractor) and Transaction Counts liveboards. You can use it as a filter for the liveboards, or you can see it in visualizations such as Overall Counts by Monthly Billing Month Year.
October 24, 2024
Search
Transactions worksheet
You spoke—we listened! Based on your feedback, we added five columns to the Transactions worksheet:
- Received Date
- Risk Address
- Risk City
- Risk State
- Risk ZIP Code
Received Date shows the date and time that XactAnalysis received an assignment. Risk Address, Risk City, Risk State, and Risk ZIP Code all work to show the location of the property damage.
We also replaced the Transaction Counts column with a new Transaction Quantity column. Unlike Transaction Counts, Transaction Quantity includes credits and, therefore, more accurately represents the number of transactions billed.
Transactions Contractor worksheet
We made two additions to the Transactions Contractor worksheet. Firstly, we added the same Received Date column mentioned above. Lastly, we added a new Unit Price column. Unit Price shows the same data as the unit prices or fees listed in the XactAnalysis Billing Report.
Liveboards
Billing (Contractor)
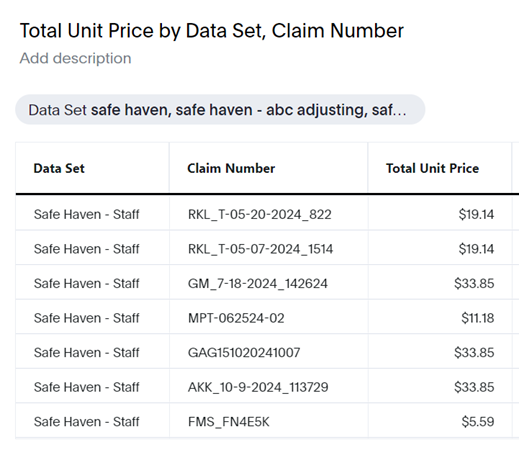
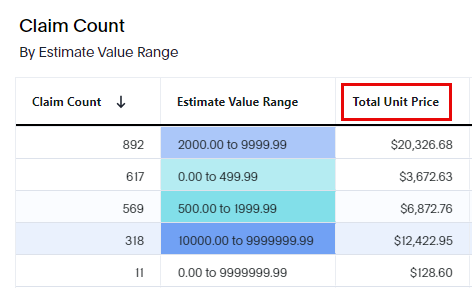
We’re happy to report that we made several requested improvements to the Billing (Contractor) liveboard. First, we moved the Billing Activity Details table from the bottom of the Overview tab to the top. Next, we added the XactAnalysis ID column to both the Billing Activity Details table and the Billing Activity Explore by Monthly Billing Month Year pivot table.
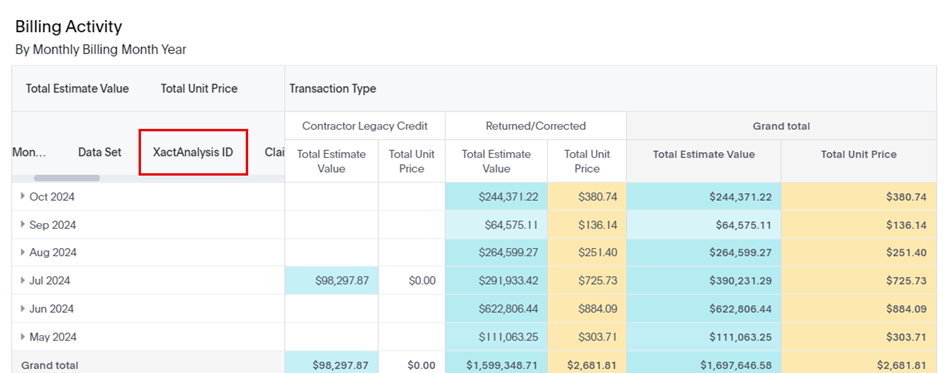
Finally, we added Unit Price to the Billing Activity Details table, the Billing Activity Explore by Monthly Billing Month Year pivot table, and the Claim Count by Estimate Value Range aggregate mini table.
September 25, 2024
Search
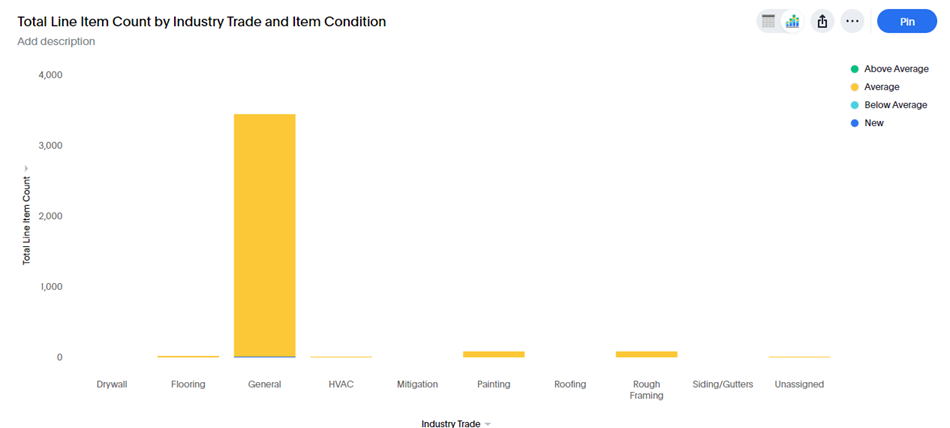
We added two new columns! First, we added the Item Condition column to the Line Item, Line Item Summary, Contractor Line Item, and Industry Line Item Data worksheets. This column shows the condition of the item, such as Average, Above Average, Below Average, and New.
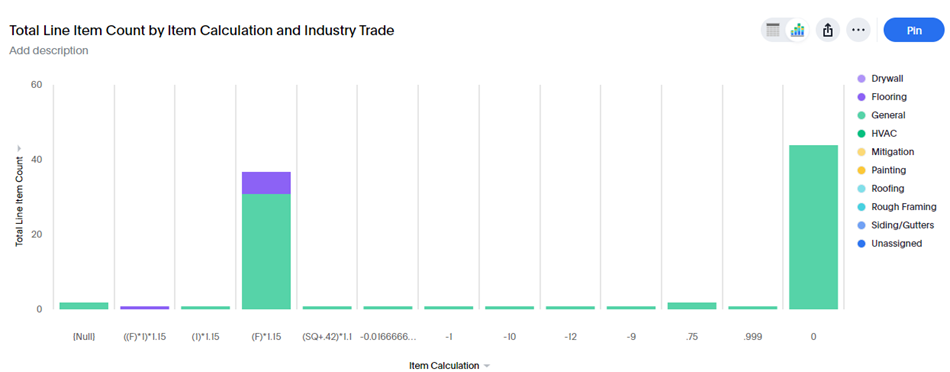
We also added an Item Calculation column. This column is available in the Line Item, Contractor Line Item, and Industry Line Item Data worksheets. It displays the information entered into the Calculation field in Xactimate.
Liveboards
Billing (Contractor)
Billing for XactAnalysis SP is transitioning to a new Customer Portal. Starting October 1, 2024, you will no longer be able to download invoices from the XactAnalysis Billing Report page. For billing data after September 2024, please use the new Billing (Contractor) liveboard in Insights!
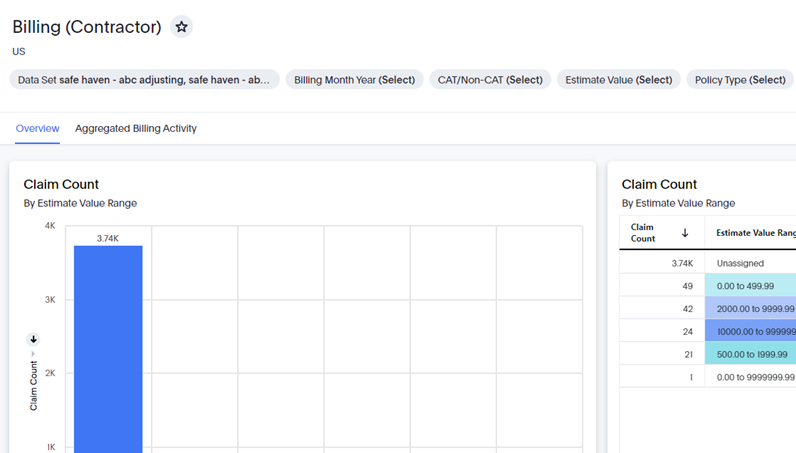
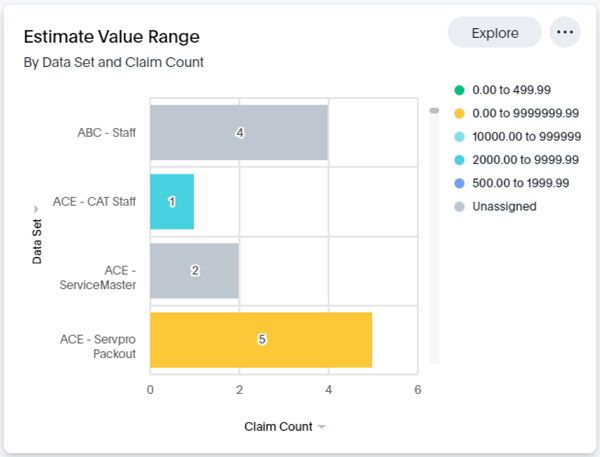
This liveboard has the same data as the Billing report, along with additional visualizations and improved customizability! The Overview tab has multiple charts and tables, including Claim Count by Estimate Value Range, Estimate Value Range by Data Set and Claim Count, and Billing Activity Details.
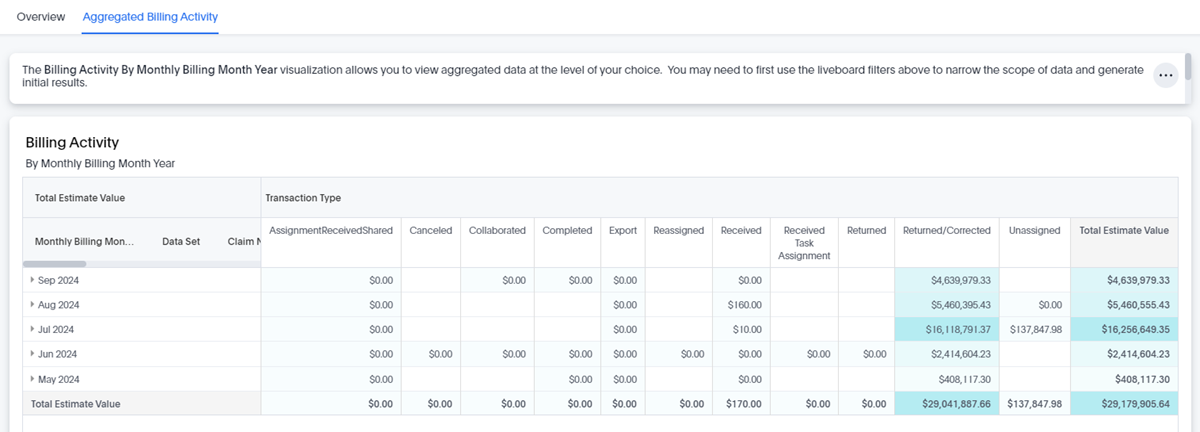
The Aggregated Billing Activity tab hosts the Billing Activity by Monthly Billing Month Year visualization, which allows you to view aggregated data at the level of your choice.
Transaction Counts
In the Transaction Counts liveboard, we moved the Overall Counts by Monthly Billing Month Year table to a new Aggregated Overall Counts tab.
August 28, 2024
Flood Analysis liveboard
We added a new Flood Analysis liveboard! This liveboard is divided into five tabs: Overview, Financials, Cycle Times, Estimatics, and Flood vs. Non-Flood.
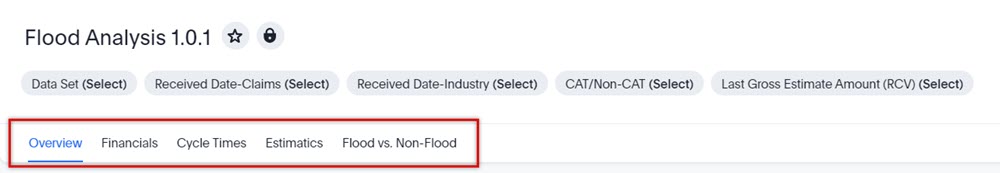
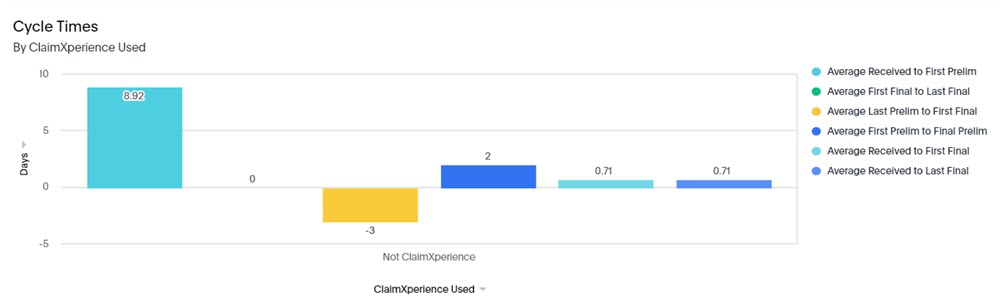
Flood Analysis includes data from two different worksheets: Claims and Industry Data. The data is essentially the same but at different levels. As a result, two Received Date filters have been created, one per level, and will only affect visualizations from the same worksheet. The Received Date-Claims filter will only affect the Cycle Times by Data Set and the Cycle Times by ClaimXperience Used visualizations on the Cycle Times tab.
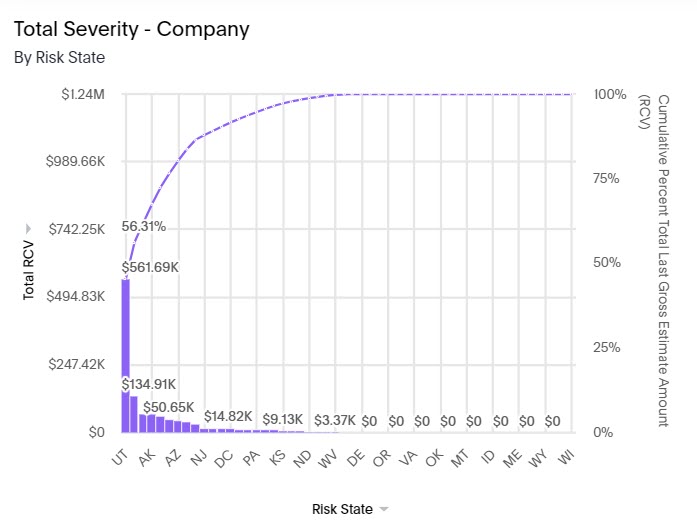
The Received Date-Industry filter will affect the rest of the visualizations in this liveboard, such as:
- Total Severity – Company by Risk State
- Category Code Breakdown Percent – Company by Total Line Item RCV
- Flood Total Line Item RCV – Company by Category Groups
Transaction Counts liveboard
We also added a new Transaction Counts liveboard, which is based on the Excel management report of the same name in XactAnalysis. This liveboard displays information about billable transactions and events that you can monitor during the month. Some visualizations included in this liveboard are:
- Overall Counts by Data Set
- Received vs. Returned
- Canceled vs. Completed
- Average Claim Transaction Counts by Month
This liveboard’s data only goes back to August 1, 2024. For transaction data before that date, please continue using the Transaction Counts management report.
July 31, 2024
Search
We added a new Item Age column to the Line Item, Line Item Summary, and Industry Line Item Data worksheets. This column shows the age of a line item.
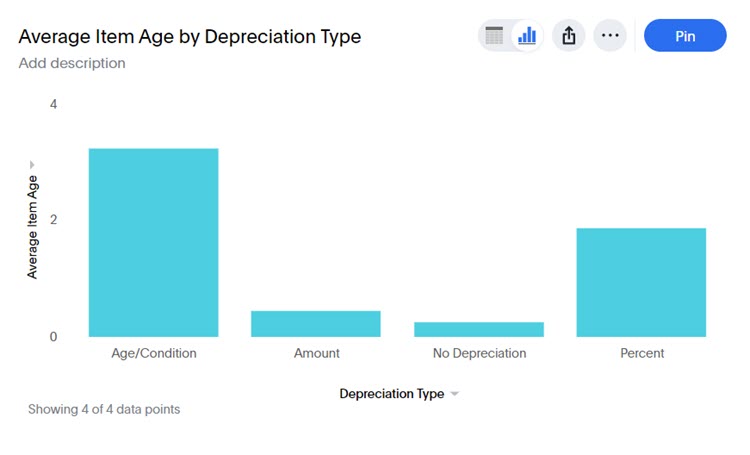
We also added the Depreciation Type column to the Industry Line Item Data worksheet. This column already existed in the Line Item worksheet, and it shows whether an item’s depreciation type is Amount, Percent, Age/Condition, or No Depreciation.
XactRebuild Analysis liveboard
We added a new XactRebuild Analysis liveboard! XactRebuild is a feature available for Xactimate Professional users; it streamlines the water mitigation claims process with automated rebuild estimates.
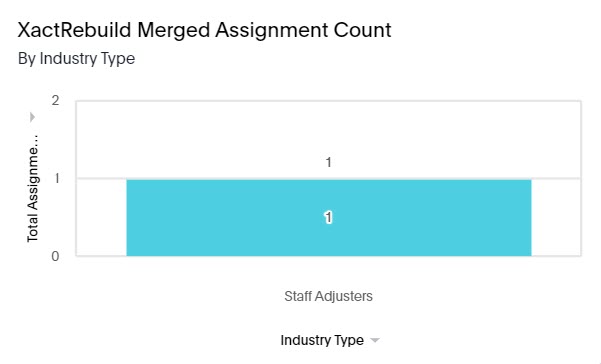
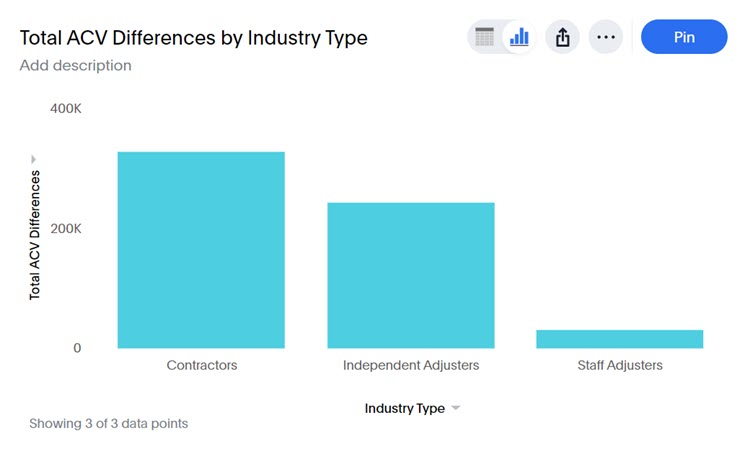
The XactRebuild Analysis liveboard has several visualizations, including XactRebuild Merged Assignment Count by Industry Type, Average XactRebuild RCV by Type of Loss, and XactRebuild Values Compared to First Completed Estimate RCV by Month.
XactXpert worksheets
Are you excited about XactXpert? So are we! XactXpert is a tool in Xactimate online that tracks errors in an estimate, such as missing information and other unmet requirements, and displays alerts to the user. To better serve you, we’ve added three XactXpert-specific worksheets to Insights.
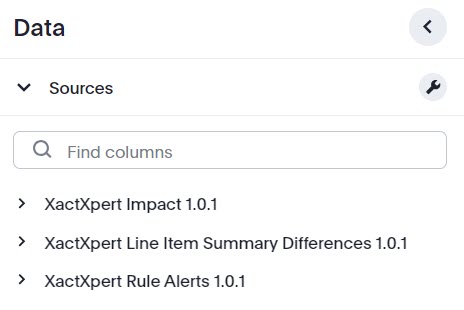
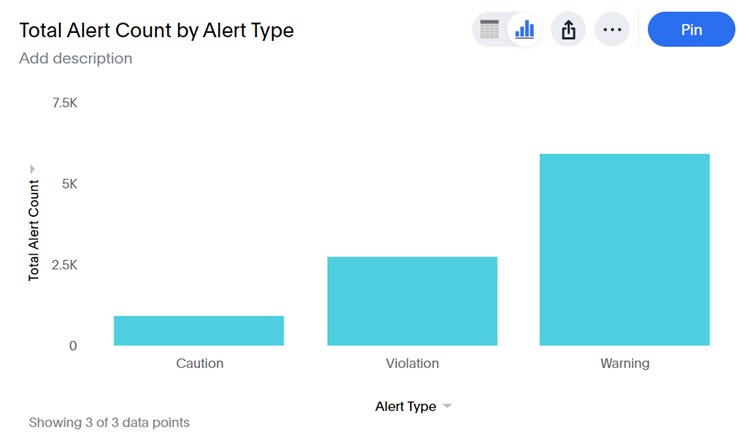
First, the XactXpert Rule Alerts worksheet allows you to analyze basic XactXpert data such as Alert Type, Bypasser Name, and Rule Owner.
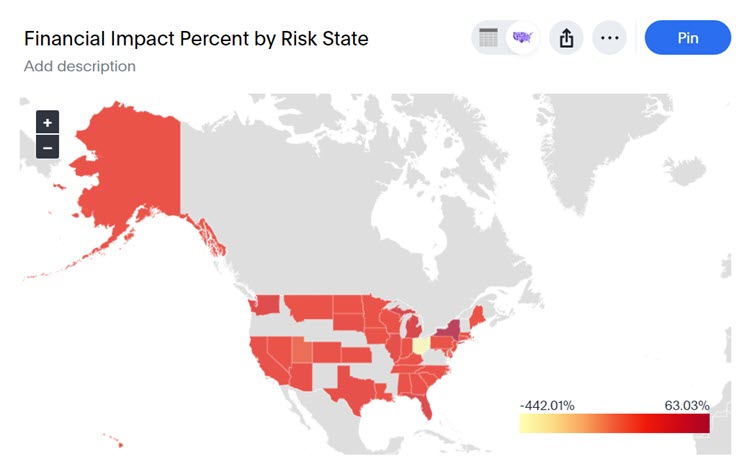
Next is the XactXpert Impact worksheet. This worksheet is at the claim level and reports on the resolve value. XactXpert Impact includes columns such as Financial Impact Percent, Resolve Absolute Value, Resolve Net Value, and more.
Finally, the XactXpert Line Item Summary Differences worksheet allows users to see the changes in line item quantities after a rule is resolved using XactXpert. For example, the ACV Differences column in this worksheet shows the change of the ACV between the XactXpert review and the completion of the estimate.
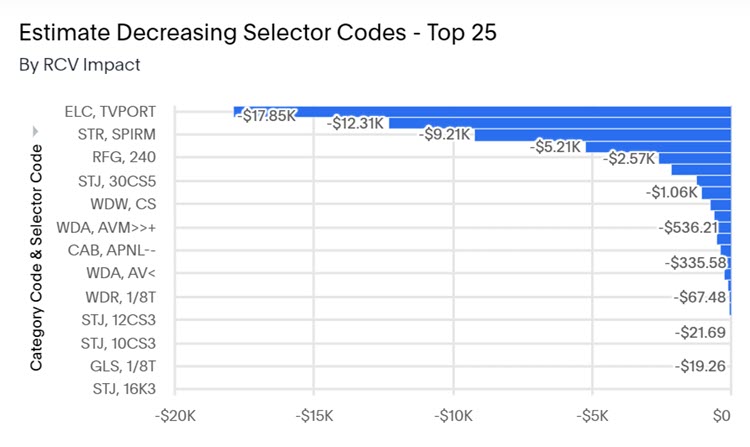
We also added a liveboard based off the XactXpert Line Item Summary Differences worksheet. This liveboard is called XactXpert Line Item Changes, and it includes helpful visualizations like Average ACV Differences by Month, Estimate Decreasing Selector Codes - Top 25 by RCV Impact, and Negative RCV Financial Impact by Data Set.
June 26, 2024
Search
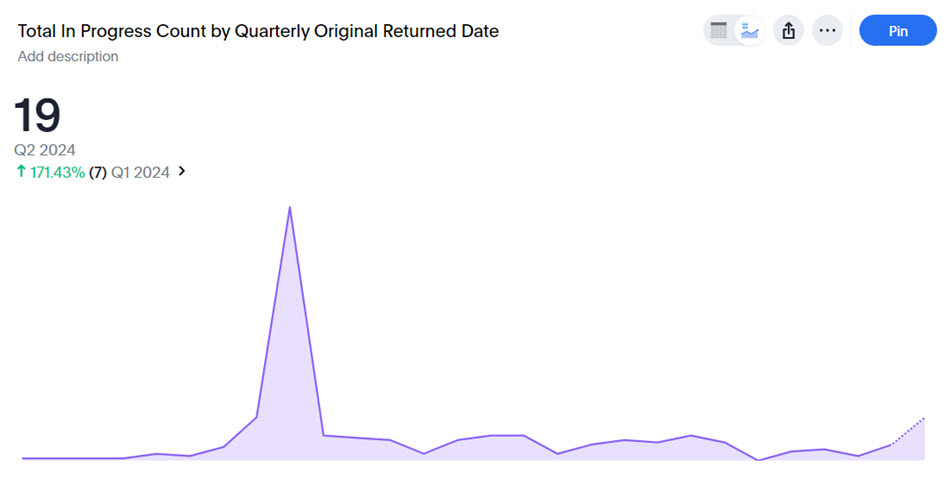
We added several new columns to Insights! First, we added the Final Returned Date and Original Returned Date columns to the Claims and Contractor Claims worksheets. Original Returned Date shows the date of the first estimate returned to XactAnalysis for an assignment, while Final Returned Date shows the date of the last estimate returned to XactAnalysis for an assignment.
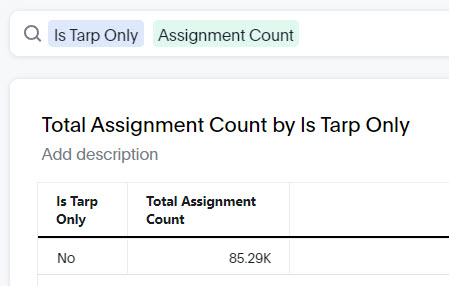
Next, we added an Is Tarp Only column to the Claims worksheet. We designed this column for situations where assignments are generated to install a tarp on a damaged roof and nothing else. You can use Is Tarp Only to flag assignments that only contain tarping line items or that are over 80% tarping-related.
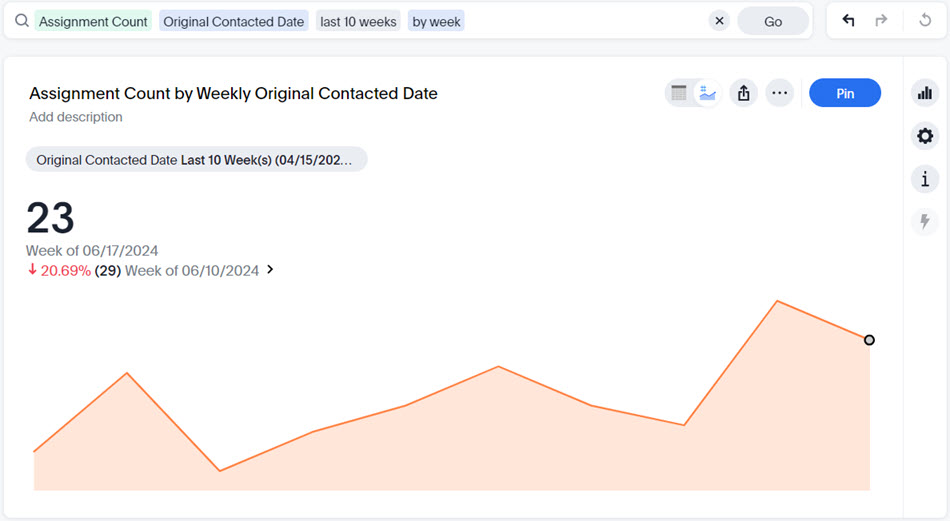
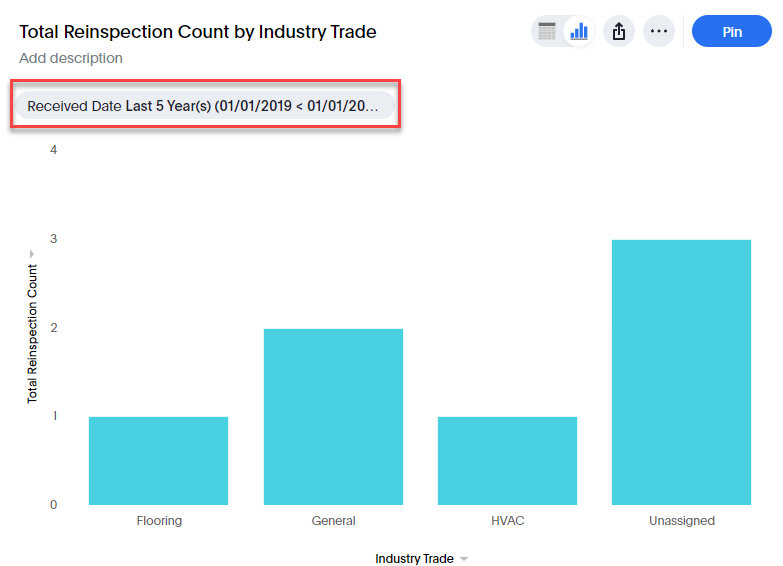
Finally, we added new Original Contacted Date and Final Contacted Date columns to the Line Item, Line Item Summary, Reinspections, and Reinspection Exception worksheets. Original Contacted Date shows the first date the customer or policyholder was contacted for an assignment, while Final Contacted Date shows the last date the customer or policyholder was contacted for an assignment.
Liveboards
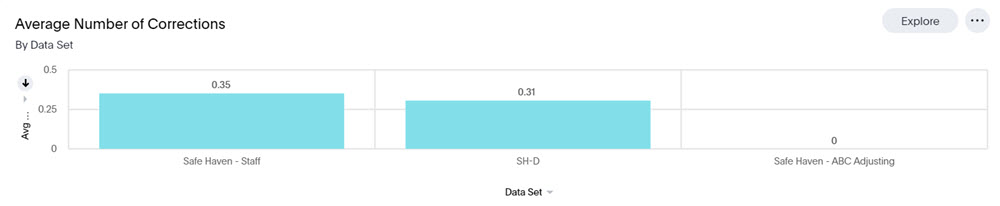
We added a new Estimate Correction Summary liveboard! Based on the Estimate Correction Summary management report in XactAnalysis, this liveboard helps you track corrections on estimates and monitor the differences those corrections make in the final estimate value.
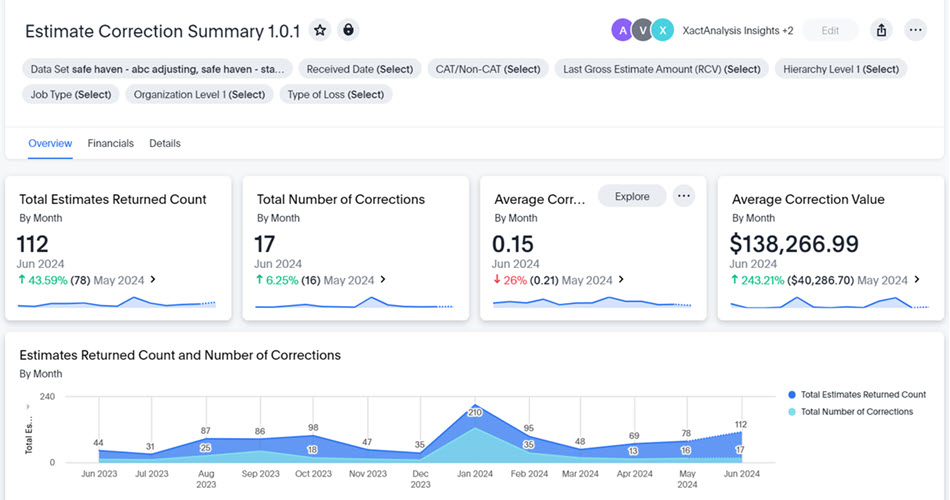
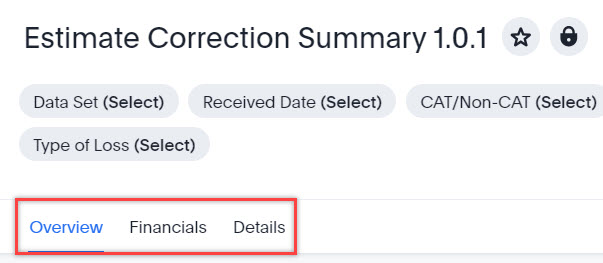
The liveboard contains three tabs: Overview, Financials, and Details. You can also filter the liveboard by data set, received date, job type, type of loss, and more.
Each tab hosts a variety of visualizations, including Average Correction Value by Month, Average Number of Corrections by Data Set, and Total Correction Difference in Value by Data Set.
May 29, 2024
New columns
We added five new XactRebuild columns! XactRebuild is a feature within Xactimate that allows users to create rebuild estimates based on the data from an existing water mitigation estimate. You can find these columns, described below, in the Claims and Contractor Claims worksheets:
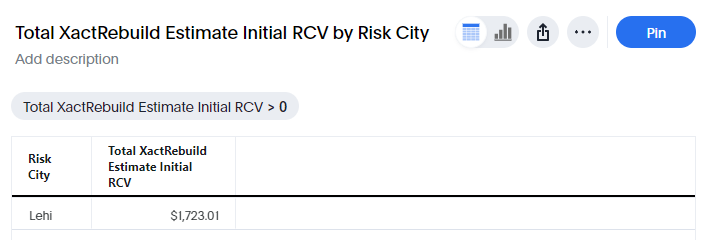
- XactRebuild Mitigation Project RCV
- This displays the original mitigation project’s estimate amount.
- XactRebuild Estimate Initial RCV
- This displays the initial XactRebuild estimate amount.
- XactRebuild Pre-merge Rebuild RCV
- This displays the final XactRebuild estimate amount before merging.
- Is XactRebuild
- This indicates whether XactRebuild was used.
- Is Merged XactRebuild
- This indicates whether the estimate was merged in XactRebuild.
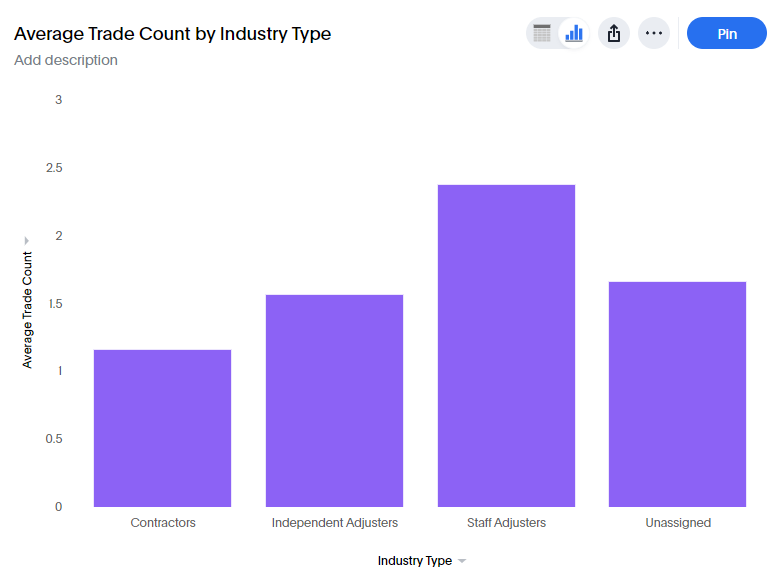
We also added a new Trade Count column to the Claims, Industry Claim Data, Contractor Claims, and Reinspections worksheets. This column shows the number of trades included in the estimate.
Other improvements
Previously, XactAnalysis QR users had access to one year of Insights data. We’re excited to now provide five years of data to XactAnalysis QR users!
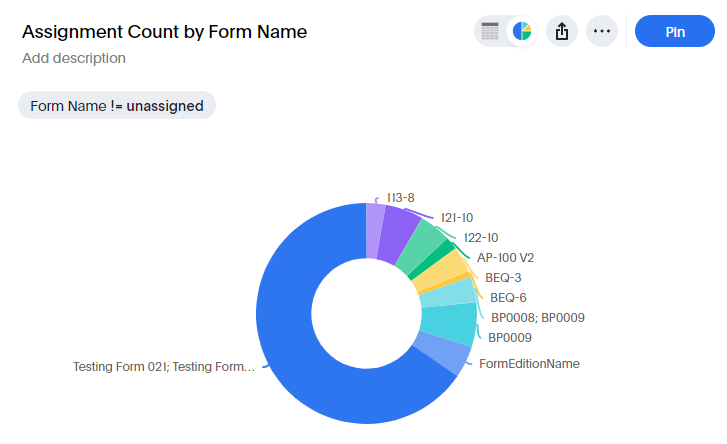
Finally, the Form Name column is now available in the Line Item worksheet. This column was already included in the Claims, Line Item Summary, Reinspections, and Reinspection Exception worksheets. You can use this column to view a list of policy forms and endorsements.
February 28, 2024
Search
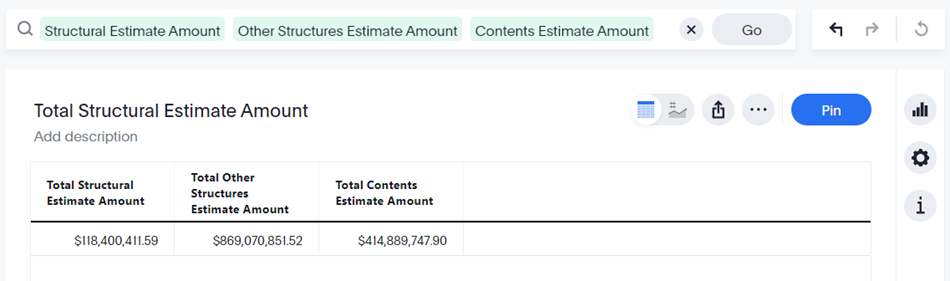
We added several new columns to various worksheets in Insights! You can find nine of the new columns in the Claims and Reinspections worksheets:
- Structural Estimate Amount
- Other Structures Estimate Amount
- Contents Estimate Amount
- Structural Deductible Amount
- Other Structures Deductible Amount
- Contents Deductible Amount
- Structural Policy Limit Amount
- Other Structures Policy Limit Amount
- Contents Policy Limit Amount
These nine columns show the estimate amount, deductible, and policy limit for three common coverage types: structural, other structures, and contents.
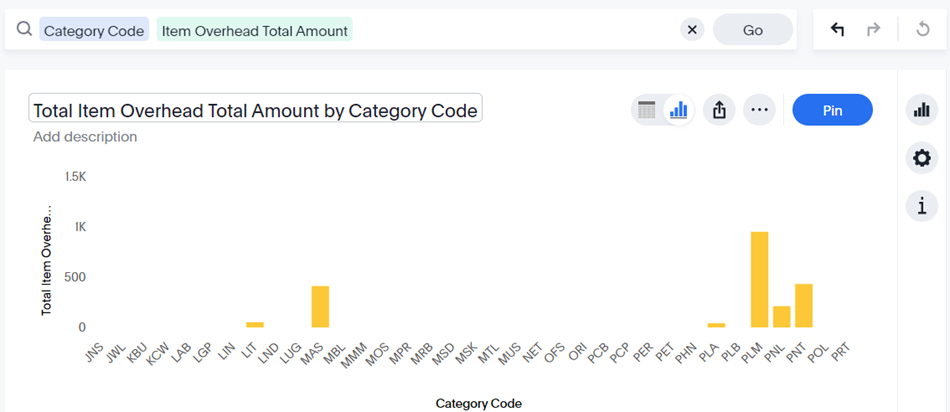
We also added two new columns—Item Overhead Total Amount and Item Profit Total Amount—to the Line Item, Line Item Summary, Contractor Line Item, and Industry Line Item Data worksheets. These columns allow you to view overhead and profit at the line item level.
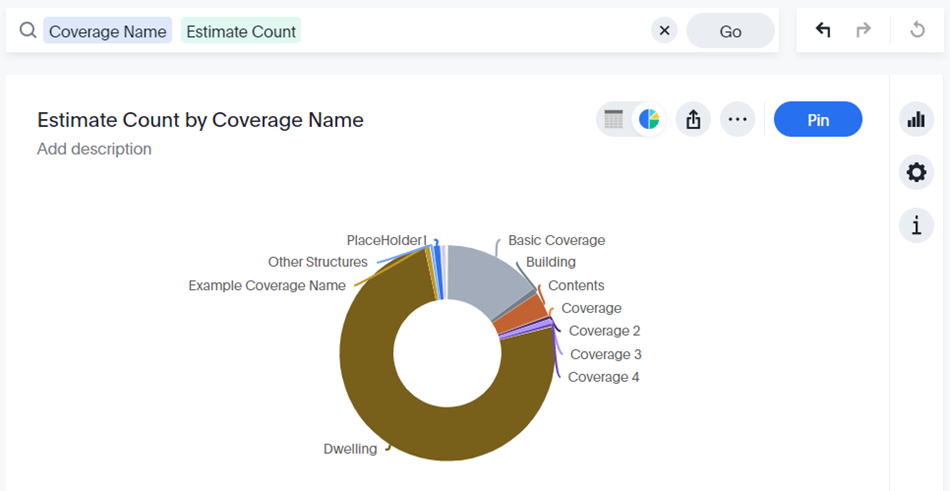
Finally, we added a Coverage Name column to the Line Item and Line Item Summary worksheets. This column displays the name attached to a coverage type in Xactimate.